Business multiples: what they are and why one should use them?

Value investing tools
To find an undervalued company, you need to have tools for quick monitoring and search. Several factors, the so-called “multiples”, have been developed that solve this problem. The multiple is the ratio of the market value of the company (or its value) to production or financial indicators and allows you to compare different company analogs.

Let's take a look at 10 useful multiples that can be used to value stocks in different countries. Each of them has its characteristics, advantages, and limitations.
- P/E
- PEG
- P/CF
- P/B
- D/E
- EV/EBITDA
- EV/S
- ROE
- ROA
- DPR
P/E Multiples
Multiples P/E (Price to Earnings, alternative name: PER) is a coefficient reflecting how much investors pay for each unit of net profit. This multiple represents the ratio of the company's capitalization to its net profit. Calculated for a quarter, half a year, or a year. In other words, the multiple shows how many years the investment will be recouped through net profit.
The higher the value of the indicator, the longer the return on investment, which is worse for the investor.
The P/E multiple is recommended for comparing companies within the same type of activity. Since the size of the net profit varies greatly from industry to industry. Thus, industries will have lower P/E ratios than IT companies.
The formula for calculating the coefficient is as follows:
Calculation option No. 1. The formula for calculating the indicator through net profit:

Where:
Market Cap – the market value of the company. Calculated as the value of all issued shares on the stock market.
Earnings (net profit) – the final financial result of the company's activities, showing the effectiveness of activities minus all costs, taxes, contributions.
Calculation option No. 2. The formula for calculating the ratio through earnings per share (EPS):

Price (market price) – the value of the company's shares on the stock market.
EPS (Earnings per share) is the company's earnings per share.
Standard values of the P/E multiple
If the coefficient is less than 10, then the company is investment-attractive and has growth potential. If it is more than 20, then it is overvalued and its value in the stock market may begin to fall. According to a study by Sheridan Titman, K. C. John Wei, and Feixue Xie (2002), companies with a P/E of more than 25 tended to lose market value within 2-3 years to a P/E ratio of 17.5.
When comparing similar companies by field of activity and financial performance, priority is given to the one with the lower P/E. Sometimes the P/E serves as an indicator for companies that may be taken over (bought) by competitors. The table shows the recommended guideline values ↓
The advantages and disadvantages of the P/E multiple
(+) The simplest and most used indicator of company valuation by investors.
(-) May be incorrectly reflected due to the seasonality of net profit, accounting policies.
(-) Does not include a one-time profit or loss.
(-) Strongly depends on the structure of the company's debt. Ignores the impact on the company of debt obligations.
«There is a lot more to intrinsic value than P/E» (W. Buffett)
PEG multiple
PEG (Price Earnings Growth ratio) shows the degree of overvaluation or undervaluation of a stock. It is a variation of the P/E ratio. And besides, it represents the relation of the P/E ratio to the growth rate of earnings per share. The ratio reflects how much investors are willing to pay for future profit growth.
The formula for calculating PEG is as follows:

Where:
P/E is a multiple presented as the ratio of the company's capitalization to net profit (Earnings).
EGR (Earnings Grow Rate) – the expected growth of earnings per share (EPS, Earning per Share).
Standard values of the PEG multiple
It is recommended to filter out stocks with values greater than 3, as these are stocks that are too overvalued by the market and the market price may begin to decline. Standard values are presented in the table ↓
The advantages and disadvantages of the PEG multiple
(+) The main plus of PEG is that it does not take into account a point evaluation like P/E, but makes the forecast for the future development of the company based on the rate of profit growth.
(-) Forecasting future earnings per share is carried out by analysts, which adds subjectivity to the assessment. Because there may be too optimistic or negative assessments of the pace.
(-) There is no opportunity to take into account the financial risk (risk of bankruptcy) of the company. To solve it, it is necessary to additionally analyze the current, quick liquidity ratio, Altman's Z-score, Debt/Equity.
P/S Multiple
P/S Multiple (Price to Sales ratio) reflects how much the investor pays per unit of revenue and represents the ratio of the company's capitalization on the stock market to its revenue.
The ratio is more universal than the P/E multiple because uses the proceeds. As a result, it can be applied to the valuation of any company, even those with negative net income. In some places, revenue is a more accurate indicator, because it is more difficult for them to manipulate than net profit since its size depends only on the size of sales, and the way of accounting affects the net profit. Such manipulation can be beneficial for a company that aims to show its investment attractiveness.
Calculation option No. 1. The formula for calculating the P/S multiple:

Capitalization is the market value of a company on the market (the value of all issued shares on the company's stock market).
Revenue is a profit from the sale of products/services.
Calculation option No. 2. Variation in calculating the coefficient through the return on sales:

Where:
ROS – return on sales;
P/E – price/earnings multiple.
There is a clear correlation between return on sales and net income.
Standard values of the P/S multiple
If the coefficient is less than 1, then the company is investment-attractive and has growth potential. If it is more than 2, then it is overvalued and its value in the stock market may begin to decline. If a company has a low market value with strong production and sales volume, then it can be absorbed by competitors through mergers and acquisitions.
The advantages and disadvantages of the P/S Multiple
(+) Universal. Easily used to compare any company even those with different accounting standards.
(+) Stability. The volatility of revenue is significantly lower than that of net income.
(-) Does not take into account the company's cost structure, financial stability, and profitability.
P/CF Multiple
The P/CF (Price to Cash Flow) multiple shows the ratio of the market capitalization to the company's cash flows.
The formula for calculating the indicator is as follows:

Where: Price (capitalization) - the market value of all shares of the company on the stock market.
Cash Flow - cash flow from operating activities. Cash flow is not reflected in the reporting of domestic companies and it is required to make adjustments to the net profit on depreciation, movement of liabilities, and change in assets.
Cash flow and net income are very similar indicators, but they have many differences. Let's analyze them ↓
Cash flow better reflects the financial condition of the company than net profit.
Cash flow values can be calculated in two ways: direct and indirect methods. Therefore, it is more correct to use FCF (Free Cash Flow). Cash flow (CF) does not take into account the company's capital expenditure.

Free cash flows can be of two types:
- FCFF (Free Cash Flow for Firm) – free cash flow of the company (assets). Used by investors and lenders;
- FCFE (Free Cash Flow for Equity) – free cash flow from the capital. It is used by shareholders and owners of the enterprise.
And both of these values can be applied in the calculation formula.
Also, instead of free cash flow, another artificially created CE indicator can be used. This is not an accounting or financial criterion that does not show the return of shareholders, such as FCF. But some analysts use it as one of the types of profit.
Standard P/CF ration value
The advantages and disadvantages of the P/CF multiple
(+) More informative and difficult to manipulate than the P/E ratio.
(+) The indicator reflects the real money that the company has at the moment. It is the cash flow that assesses the company's ability to pay dividends.
(-) Not suitable for evaluating fast-growing companies that have negative cash flows or high volatility.
P/B Multiple
The P/B multiple (Price to Book Value, analogous to P/BV, P/B ratio) is a coefficient that shows the ratio of the market value of shares to the book value of net assets (equity). In other words, it reflects what the shareholder will receive in the event of bankruptcy of the company. In the process of liquidation of the company, its property is sold and divided among shareholders.
The formula for calculating the P/B indicator is as follows:

Market value – market capitalization (value of shares x amount).
Book value – property of the enterprise (net assets). Net assets represent the difference between the assets of the company (Total Assets) and all its liabilities (Total Liabilities).
Standard values of the P/B multiple
The advantages and disadvantages of the P/B multiple
(+) Stability. The value of the P/B ratio is stable because based on the assets of the company.
(-) Does not include intangible assets. The coefficient assesses only how much money investors are willing to pay for a unit of a company's property and does not include intangible assets, reputation, brand, and other factors that are difficult to assess. Therefore, P/B is difficult to evaluate high-tech IT companies.
(-) Does not take into account growth potential. The ratio does not show the company's ability through free cash flow from capital (FCFE) to shareholders, which can be used to increase the return on equity of the company (ROE).
D/E Multiple
D/E (Debt to Equity ratio, analogous to Leverage) is the ratio of the company's financial condition, representing the ratio of borrowed funds to the amount of equity capital. This ratio is similar to the autonomy ratio (difference: the denominator uses assets that represent the amount of equity and borrowed funds). Another name for the D/E multiple is the financial leverage ratio.
The economic meaning of financial leverage is that the use of borrowed funds can increase the company's profitability. This principle is taken from physics, where, with the help of a lever you can lift more weight, and here it also allows you to increase the company's profit. An increase in the share of borrowed funds in the capital structure leads to an increase in financial risk (bankruptcy risk) and a decrease in financial reliability.
Calculation option No. 1. The formula for calculating the D/E ratio for the balance sheet:

Liabilities - Includes loans, capital expenditures, prior debt, insurance premiums, etc.
Calculation option No. 2. The formula for calculating the D/E ratio using long-term liabilities:

Calculation option No. 3. The formula for calculating the D/E ratio in terms of profitability:

Where: ROE - return on equity
ROA is the return on assets.
Standard values of the D/E multiple
It is necessary to analyze this coefficient in dynamics, comparing it with the industry average values.
The leverage ratio must be used in conjunction with other ratios for assessing the investment attractiveness of a company, such as P/E, P/B, P/S, etc.
EV/EBITDA Multiple
EV/EBITDA (Enterprise Value/Earnings before Interest, Taxes, Depreciation, and Amortization) is a coefficient reflecting the ratio of the company's fair value to its profit. Allows one to compare the value of the company with each other. This metric is similar to the P/E ratio and also shows the payback period of the company's value from profit before tax and depreciation payments.
The formula for calculating the indicator is as follows:

Where:
EV (Enterprise Value or Firm Value) – the company’s worth.
EBITDA (Earnings Before Interest, Tax, Depreciation, Amortization) is the company's profit before deducting interest, taxes, depreciation, and amortization expenses.
P – the market capitalization of the company.
Debt – Obligations.
Cash – cash.
Net Debt – the company's net debt.
The EV/EBITDA multiple solves one of the disadvantages of the P/E multiple – the influence of borrowed capital (financial leverage). Thus, companies that raise funds have a more attractive P/E, but at the same time, a greater financial risk. And in the EV/EBITDA multiple, the debt obligations are reflected in the company's value – EV. Thus, EV/EBITDA allows comparing companies with different debt and tax burdens.
Standard values of the EV/EBITDA multiple
The advantages and disadvantages of the EV/EBITDA multiple
(+) Easily calculated from data in financial statements.
(+) Less volatility of EBITDA change than P/E profit.
(+) Takes into account financial risk. Compares companies with different leverage as opposed to P/E.
(+) Assesses sustainable companies with low capital expenditures.
(+) Takes into account depreciation and tax burden.
(-) Does not include capital costs.
(-) EBITDA does not include all cash flows. Therefore, it is used with a P/FCFE ratio.
EV/S Multiple
EV/S (Enterprise value/Sales) is a coefficient showing how much annual revenue a company is worth. And it represents the ratio of the value of the company to its revenue for the period (quarter, half-year, year). This metric is a sophisticated modification of P/S, where the market cap has several adjustments for liabilities and cash.
The formula for calculating the EV/S ratio:
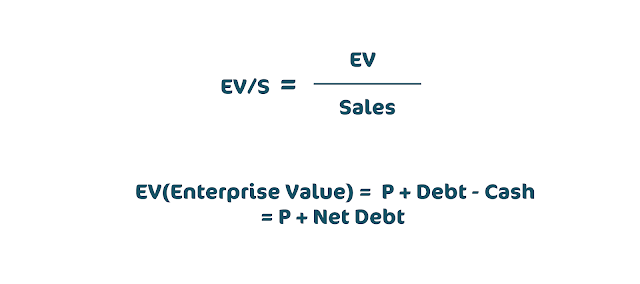
Where:
P – the market capitalization of the company.
Debt – Obligations.
Cash – cash.
Net Debt – the company's net debt.
Standard values of the multiple:
The advantages and disadvantages of the EV/S multiple
(+) Gives additional adjustments to the company value. Adjusted for debt and cash availability (as opposed to P/S).
(+) Stability. Revenue is subject to fewer changes than net income (such as in P/E)
(-) Does not take into account financial risks and capital structure.
ROE Multiple
ROE (Return on shareholders’ Equity) is a coefficient showing the profitability of the company's equity capital. In other words, how much profit comes from a unit of equity. The indicator reflects the efficiency of capital management by the company's management, which affects its investment attractiveness and financial stability.
The formula for calculating ROE is as follows:

Standard values of the ROE multiple
The higher the return on equity capital, the more investment-attractive the company is. Below are the normative values for this coefficient ↓
ROA Multiple
ROA (Return on Assets) is a coefficient reflecting the profitability of a company using its assets. It is calculated as the ratio of net profit to the value of assets. The coefficient is one of the main performance indicators and shows how much profit has been brought by equity and borrowed capital.
Calculation option No. 1. ROA calculation formula:

Where:
Net Income – net profit after tax;
Total Asset – the sum of the company's assets.
Calculation option No.2. ROA calculation formula:
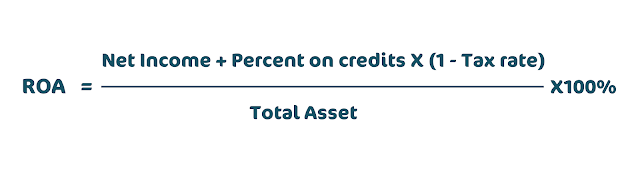
Where:
Percent on credits – interest on loans issued.
There are various modifications of the ROA ratio based on the use of different types of profit: EBIT (operating profit), profit before tax, profit margin.
Standard values of the ROA multiple
The higher the return on assets, the more investment-attractive a company is in the eyes of investors.
ROA analysis of companies should be carried out in one industry since capital-intensive businesses will be less important than telecom and IT companies.
DPR Multiple
DPR (Dividend Payout Ratio, analog of PR, Payout ratio) is an indicator that reflects how much of the net profit is sent to dividend payments. The coefficient shows the quality level of the stock.
There are two possible dividend policies:
- The approach according to the Modigliani-Miller theory. Dividend payments are sent to shareholders after meeting the company's needs for expansion, production, capital construction, investment.
- Gordon's approach. Dividend payments need to be made continuously and at an increasing pace. To create an increase in investment attractiveness in the stock market and satisfy the interests of shareholders.
The main goal of the company's dividend policy is to distribute profits and dividend payments in such a way as to maximize the company's value.
Currently, the second approach to managing dividend payments dominates.
Calculation option No.1. The formula for calculating DPR is as follows:

Where:
DPS (Dividend per share) – the number of dividend payments per share.
Calculation option No.2. The formula for calculating DPR through net income:

Standard values of the DPR multiple
In investment practice, the following values of the Payout ratio (DPR) were identified ↓
When analyzing the dividend payout ratio, it is necessary to assess the nature of the trend. So if it is steadily upward, then the company is steadily expanding. If the indicator has sharp jumps, then this indicates financial instability and poor management policy. Many startups and IT companies do not pay dividends but send everything to reinvestment.
The DPR value can be over 100%. The score for American Campus Communities (ACC) = 240%. The amount of dividend payments does not show the financial stability of the company but reflects its dividend policy. High values are the first sign that dividend payments will decrease shortly, and this is a negative factor for the growth of stock prices.
The principles of value investing according to B. Graham
Let’s see into the key principles of value investing:
- The securities market is not efficient. In other words, the value of a share may differ from its intrinsic value.
- Over time, there is a tendency for intrinsic value to equalize to the real price in the capital market. As a result of this process, there are always undervalued and overvalued assets on the stock market.
- An investment portfolio made up of undervalued stocks can bring returns above the S&P index. That is, a value investing strategy can outperform the passive buy&hold strategy of investing in indices (index funds).
To search for a company with the maximum growth potential in the future, three factors of influence are distinguished:
- The size of the company (tangible and intangible assets are twice as large as liabilities).
- Financial sustainability.
- No losses (making a profit over 10 years)
- Net profit growth of at least 30% over the past 10 years.
- Positive dividend history over the past 20 years.
- Current liquidity ratio> 2.
- Monetary multiples.
- P/E < 15
- P/B < 1.5
- P/E * P/B < 22.5
The final analysis will be the presence of growth potential of at least 30% (in Graham's terminology, the so-called “safety margin.” The difference between the real value and the value in the market).
The safety margin is the key point that differentiates the strategies of speculators and investors. This is how speculators chase the current price changes, while investors find the potential for sustainable price growth in the future.
Additional drivers for market value growth
Additional factors are affecting the growth of undervalued stocks:
Investment projects. Expansion of capacities of enterprises, construction, implementation of investment projects leads to an increase in the assets of the enterprise and its intrinsic value.
The growth of financial ratios. An increase in the value of key financial ratios (net profit, profitability, turnover, financial stability, liquidity) leads to an increase in investor interest in the company's shares. Financial indicators are reflected in quarterly reports. If the indicators turn out to be several times better than predicted, then this leads to an increase in the company's price on the stock market.
Merging and acquisition. The reorganization of a company leads to a change in its capital structure and the size of its assets, which leads to an increase in its intrinsic value.
Repayment of the debt. Reducing the size of the debt burden improves the financial performance of the company and increases its attractiveness.
Expectation and amount of dividends. The announcement of dividend payments attracts investors to receive them and creates “dividend rallies”. The larger the number of payments, the more people who want to receive payments and the more there is a rise in price before the cut-off date.
Warren Buffett's portfolio
Let's take a look at the portfolio of Buffett, the current spokesperson for the school of value investing. ↓
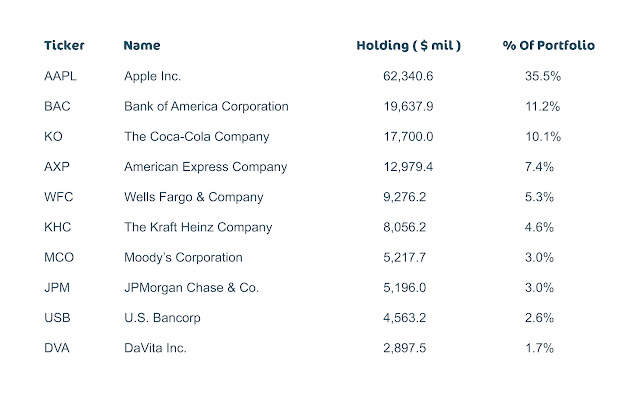
Having looked at the composition of W. Buffett's portfolio on the website finbox.io, you can see that he invests in companies that are leaders in his segment. At the moment, he still added a share of the IT company (Apple), which is much overvalued and has a P/E = 24.5. It takes over 30% of his portfolio!
His portfolio is built around the following principles, which expand on Graham's approach:
- Investing in companies "understandable" for investors. For example, Coca-Cola, because he likes the drink.
- Return on equity and net profit margin is high.
- The company must continually grow in profit.
- The company has the potential to grow and scale in its sector.
- The owners of the company have a positive reputation.
When does a value investing strategy work?
The strategy of value investing shows itself 100% during the crisis. In times of crisis, stocks are sold out because money and cash are given priority. The fall during the crisis tends to affect all companies, large and small. As a result, the market value is less than the value of the property they represent.
The crisis is a great time to invest and in some places a win-win strategy. It is during the crisis that multibillion-dollar capitals are created.
Fama and French study on the impact of the P/B multiple on price
In the 90s, Eugene Fama and Kenneth French conducted a study of the effect of the BTM ratio (book value to B/P price, inverse of the P/B multiple) on changes in the value of a company's stock. The analysis used American stocks from 1963 - 1990, traded on the NYSE. As a result, interesting patterns were obtained.
The histogram shows the difference between the returns on stocks selected by value analysis (P/B) and growth stocks ↓

As a result, cheaper small stocks with higher intrinsic values posted a 21% CAGR. Whereas the shares of large growth companies showed a yield of 8%.
French and Fama also noted that cheap stocks had a low beta (β) – reflecting market risk, while expensive stocks had a high market risk.
Portrait of an Undervalued Company and a Growth Company by Fama & French
Let's consider what factors determine small companies with growth potential and large ones that are overvalued by the market. As you can see, they have directly opposite values of the coefficients of cost, production efficiency, sales, etc.
How is the size of a company determined?
The size of the company is determined by the analyzed sample of companies, the calculation of all possible values of capitalization, and finding the average value. This criterion divides into two groups by size: small and large.
Experiment Results
Small undervalued companies showed higher returns than growth companies, but at the same time, the standard deviation of returns (volatility, risk) was higher for them. The result of their research was the emergence of a three-factor model CAPM, which says that the return on stocks (assets) determines market risk, BTM (B/P), and company size.
The advantages and disadvantages of Value Investing
(+) High profitability. The method allows us to find stocks of companies that, in the future 3-10 years, can give a yield higher than the market average.
(-) Time-consuming. One needs to analyze quite a few companies to find investment-attractive ones.
(-) Long investment cycle. Sometimes you have to wait too long for a company to be valued fairly by the market.
Conclusions
Value investing - is a fundamental analysis of the financial, market indicators of a company and the search for those that have the potential for growth in market valuation. It is not enough to use only value investing to search for undervalued shares; it is also necessary to take into account the phase of the company's development, the relative value in the stock market, and the state of the economy. One of the best times to apply a value investing strategy is during a crisis when company stocks go down in value. But at the same time, companies, both in the time of crisis and in conditions of prosperity, will have their equipment, production facilities, infrastructure, and human resources.
For a comprehensive assessment of a company, it is necessary to evaluate multiples for various groups: undervaluation in the market (P/E, P/S or EV/S, PEG, EV/EBITDA), financial condition (D/E), profitability (ROA, ROE), and dividend policy (DPR).


